Macro & Economic Data Recap
Recent data shows a patchwork of slowing consumption, softer housing, and mixed manufacturing signals.
U.S., January personal spending declined (-0.2%), while durable goods orders beat expectations (+3.1%). The labor market remains tight despite upticks in layoffs—particularly in government-related roles.
Eurozone data was mixed: Germany’s Q4 GDP slipped (-0.2%), and consumer confidence fell short (GfK -24.7). Meanwhile, French inflation dipped below 1%, a surprise on the downside.
China’s manufacturing PMI surprised to the upside at 50.2, suggesting a modest expansion.
Market Impact and Price Action
Equities: Renewed caution amid “growth scare” headlines has driven a rotation out of high-profile tech (the “Magnificent-7”) into broader markets. Despite this, AI-related names (like Nvidia) remain resilient on strong sales forecasts.
Fixed Income: Treasury yields continue drifting lower, reflecting a pivot toward safety as central banks are expected to further cut rates.
Commodities & FX: Gold has seen consistent inflows as a safe haven. Oil has weakened (Brent < $73) on oversupply concerns and demand uncertainty. The U.S. dollar retreated slightly from its peak, but overall remains historically elevated.
Momentum Analysis
Despite an ongoing uptrend in many risk assets at the daily level (especially for major stock indices), short‑term momentum is uneven. Meanwhile, Treasuries remain the clearest winner, with strong positive momentum across all timeframes.
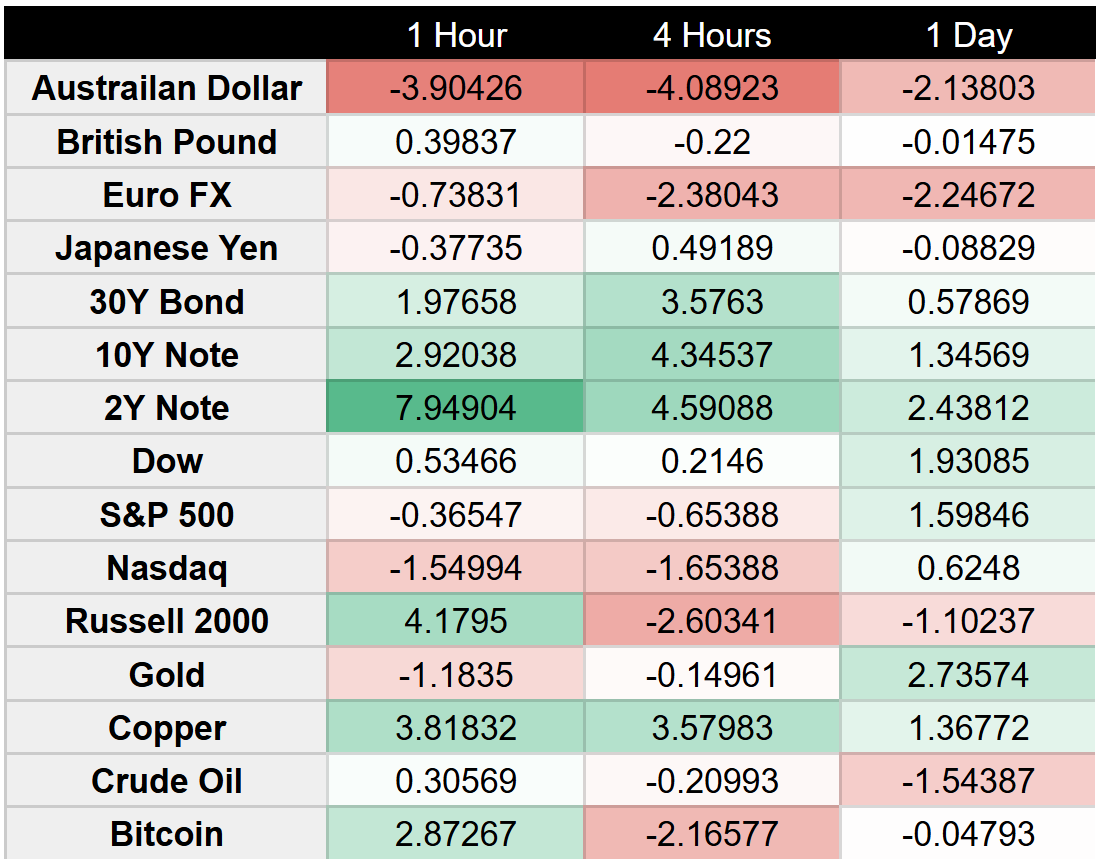
FX
FX mostly leans toward a firm USD, with AUD and EUR notably weak; GBP is slightly more balanced; JPY choppy.
Australian Dollar: momentum is consistently negative across timeframes.
British Pound: mixed with longer horizons are near zero/negative, short intraday just turned mildly up.
Euro: uniformly negative across every timeframe.
Japanese Yen: choppy and inconsistent, with different timeframes flipping in opposite directions.
Fixed Income
Bond markets are showing strong bullish momentum across the curve (lower yields).
2 Year: strong bullish momentum (price up, yields down) across all timeframes.
10 Year: broadly bullish across the curve—10‑Year momentum is positive in every window.
30 Year: entire Treasury complex remains in a strong up‑phase (bond prices rising, yields trending down).
Equity Index
Equities are a “split screen,” with the Dow outperforming on every interval, while S&P and Nasdaq show short‑term chop and the Russell leans weaker.
S&P 500: bullish bias on the daily chart, but choppy intraday signals—some negative (240/60) vs. a recent small pop (15‑min).
Nasdaq 100: Longer‑term trend remains up, but near‑term (intraday) momentum is negative or barely below zero, suggesting headwinds in the short run.
Russell 2000: longer timeframes remain under pressure (negative momentum), yet the very short‑term (15‑min) recently flipped up. This may be a minor bounce within a bigger downtrend.
Dow Jones: stands out with consistent positive momentum across all timeframes right now.
Commodities
Commodities show short‑term reversals (Oil higher intraday, Gold softer intraday).
Crude Oil: still in a broader daily downtrend but has flipped positive in shorter timeframes, hinting at a short‑term bounce.
Gold: remains in a bigger uptrend on the daily, but short‑term momentum turned negative—likely a minor pullback within an ongoing bullish trend.
Copper: overall positive on daily and most intraday frames; a brief short‑term wobble on the 15‑min reading, but the bigger picture remains bullish.
Crypto
BTC looks to be staging an intraday bounce against a longer backdrop that’s roughly neutral/negative.
Bitcoin: near flat to slightly negative on the daily, but showing a short‑term upside pop on the intraday timeframes.
Chart Book
FX
Australian Dollar